Learn about the models
On this page we show you in detail how we work together with the models and show you some stats.
How we comunicate with the models
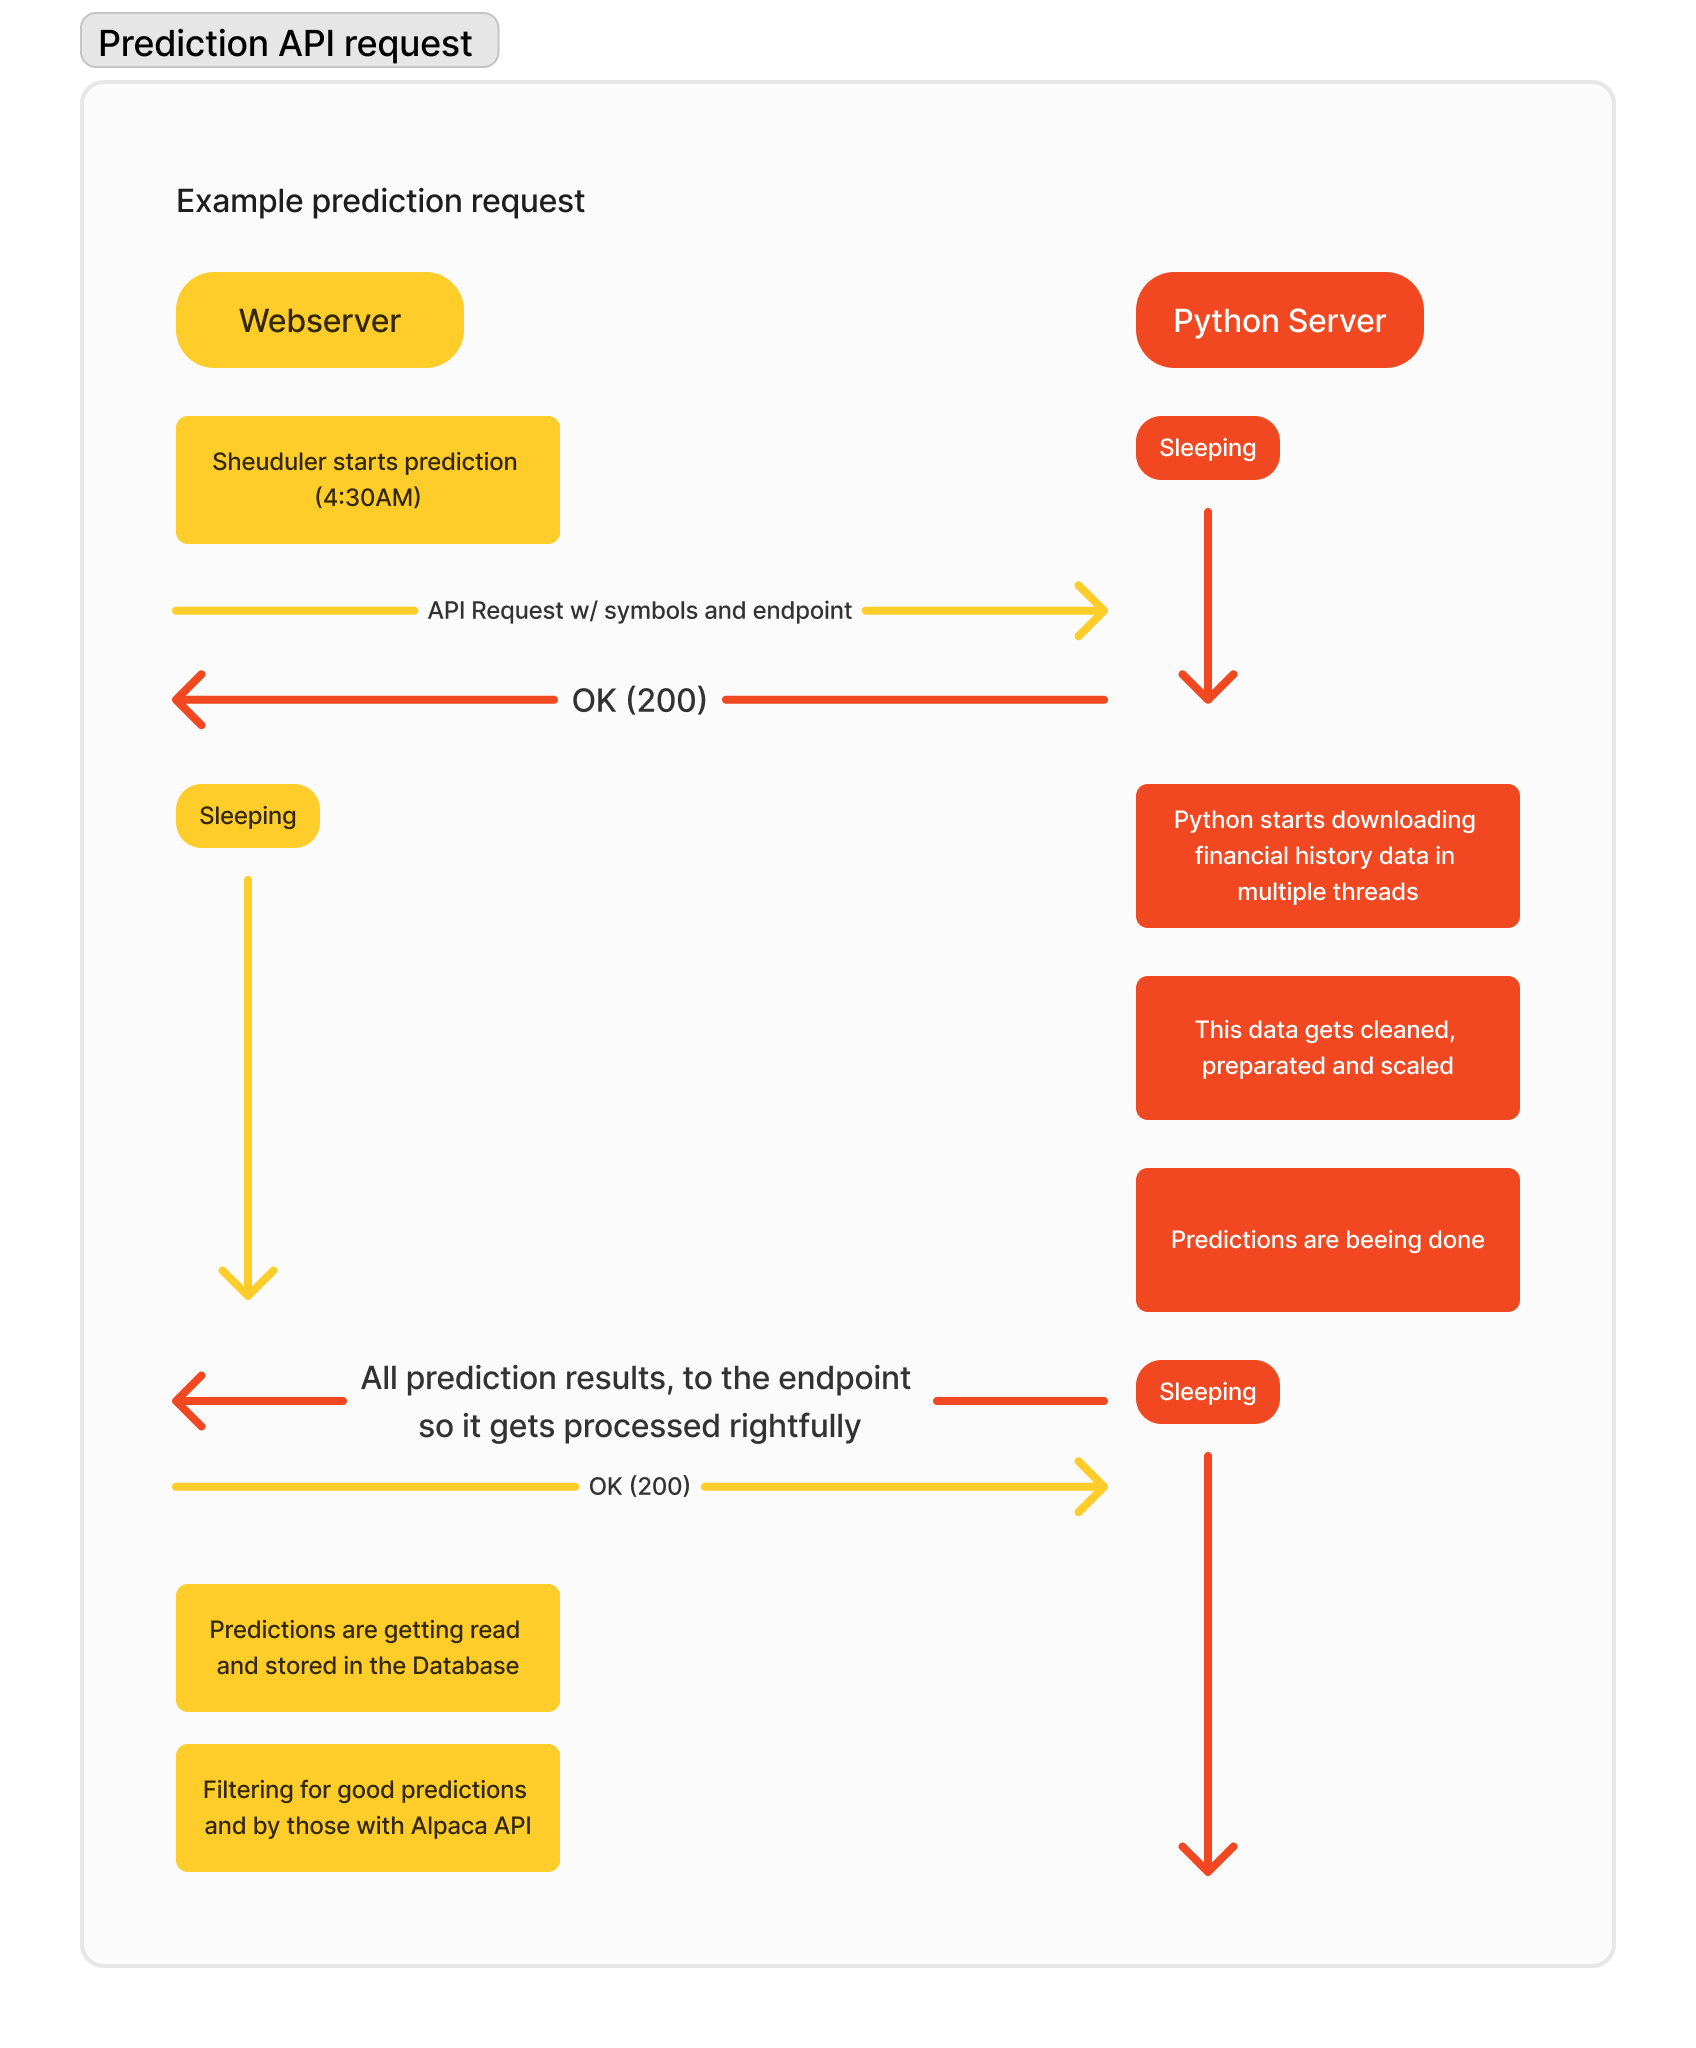
The models run on a optimized python server being hosted on heruko where we can access it 24/7 via a self build Webhook API.
It's a bit tricky to explain but because we also process big requests with over 3500 stocks we needed it to be asynchronous. That means we run the process in the background on different threads. The prediction per symbols takes in average 0.42s which means that a request with 3500 symbols upto 15 minutes takes.
That's why we needed the server infrastructure below.

The webserver is like the control panel for everything and contains algorithmen to determine if the prediction is good enought and how much money should be spend when buying a stock. It contains a scheduler that can start processes itself. Another part of the webserver is the interface to visualise the predictions and contains the business logics of buying, selling and keeping track of the portfolio. The webserver runs on php with the framework laravel. The python server is necessary because the bot was created in python due to its better performance with ai.
A sample response from the Python server with the predictions can look like this:
{
   "AAPL":{
      "date":"2024-10-16T00:00:00.000000000",
      "symbol":"AAPL",
      "relative_change":-0.0017942914385227215,
      "last_close_value":231.77999877929688
   },
   "GOOG":{
      "date":"2024-10-16T00:00:00.000000000",
      "symbol":"GOOG",
      "relative_change":0.0052414385227215,
      "last_close_value":12.124531252125214
   }
   ... 3598 more predictions ...
}
This infrastructure is needed to support the seamless and efficient predictions and management of everything. Thats why we were able to make 20.145 predictions in the past months giving us insights to the model performance nowdays.
The fully AI managed portfolio
<<<<<<< HEADAt the 18.10.2024 we started an experiment: we gave the ai an paper portfolio. We didn't touched it and the ai placed buy and sell orders on it own. Every moning before the pre market trading hours we run a predictions on all the S&P500 index stocks. If there are fulfilling predictions the web server will buy it. After the stockmarket closed, the webserver would look if the stock is still good and would directly sell if the stock met its prediction.
With this passsive runnning portfolio in the backgroud the ai made $3179.72 (8%) profit in 1 month and invested about 45,000 US dollars.
=======At the 18.10.2024 we started an experiment: we gave the ai a portfolio. Every morning before the pre-market trading hours we run a prediction on the S&P500 index. If there are outstanding predictions the web server will buy it. After every stock closes, the webserver would look if the stock is still good and would directly sell if the stock met its prediction.
With this passsive runnning portfolio in the backgroud the ai made $3179.72 profit.
>>>>>>> origin/feat/finalise-pageLet's get to the models
SAP 1
Differences in detail: The first models was just a model - it was a random forest decision tree. We chose random forests because its good with non linear data. Random forest means that there are mulitple decision trees laying over one another to be more accurate and filter out extreme values in the training. But a decision tree is not an ai, thats why we call it just a model.
The model was trained on 650,000 rows of OHLC data with 12 technical indicators. The training took 45mins and the dumped model was about 1GiB big.
SAPai 2
This was our first ever trained ai. We chose a GRU model for its strength with sequential data and the good performance. Also this is a neuronal network which means that we have neurons that are connected with eachother and it is possible to catch more details, thats why this model was way smaller than a random forest one. This model we still trained with public avaliable free resources given from google to everyone.
This model was also trained on 650.000 rows of OHLC data but with 24 technicla indicators. The training took 3 hours and 15 mins and the dumped model was about 25 MiB big.
SAPai 3
For the 3rd model we wanted to scale things up. We created a special dataset containing 10 times more data then the privious dataset. And added a bunch of the most commonly used technical indicators. We still used a keras GRU model because we think that is perfect for stock analysis.
This model was trained on 6,853,123 rows of OHLC data with 24 technical indicators. Taining took on a NVIDIA H100 GPU 46 hours and was only possible because of credits which are given to students. The file in the end was about 75 MiB big.